By the numbers, pt. 3: All about the candidates
Introduction
BallotReady has collected updated data on over 250,000 candidates in the upcoming midterms ranging from Senate to school board. Below, we have provided macro views of three components of our data: issue stances, social media links and education levels. (For each of the below graphs, you may hover your mouse over a state, or press the state if using a mobile device, to find the exact number attributed to each state. The play button on the left will allow you to zoom in, and move around the map).
Top candidate issue categories in 2022
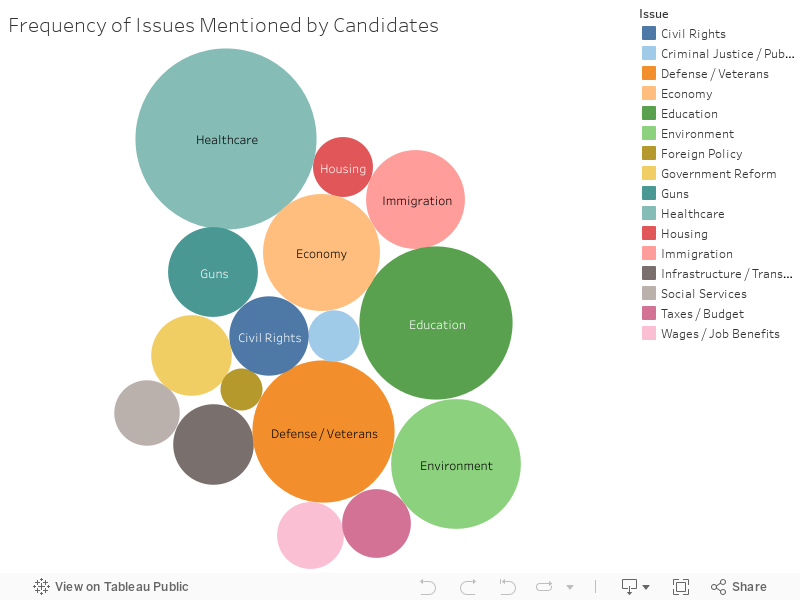
BallotReady sources candidate issue stances directly from candidate websites in order to help users find candidates they align with up and down the ballot. Using this collection of data, this graph displays which issues categories are mostly frequently addressed by candidates across the country.
Healthcare (scaled to 100 to show frequency of other topics) is the most discussed policy topic in 2022. Education, defense/veterans, the environment, and the economy round out the top five most mentioned topics on candidate’s websites.
Candidate social media preferences
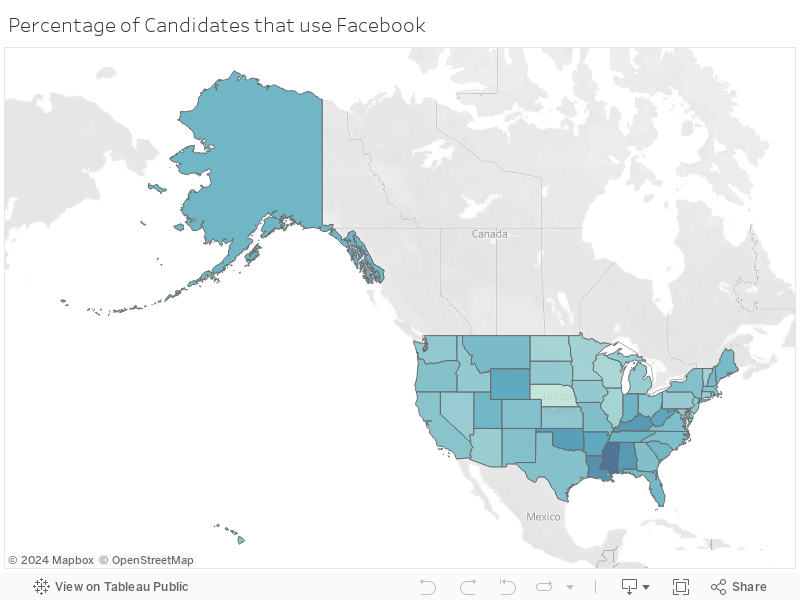
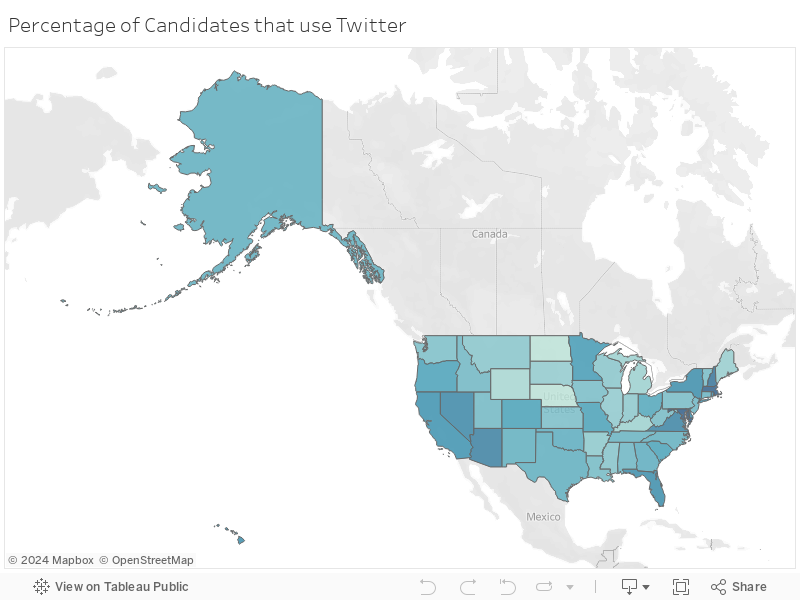
Alongside offering issue stances, BallotReady connects users with public social media accounts of candidates, an increasingly important source of candidate information. The graphs above show the percentage of candidates that have public Facebook versus Twitter accounts.
Candidates are generally more likely to use Facebook than Twitter, though there are some interesting trends regarding the popularity of these sites across states. Where Facebook is fairly popular across state lines, Twitter sees higher along the east coast, and in the Southwest and lower use in much of the south and Great Plains regions.
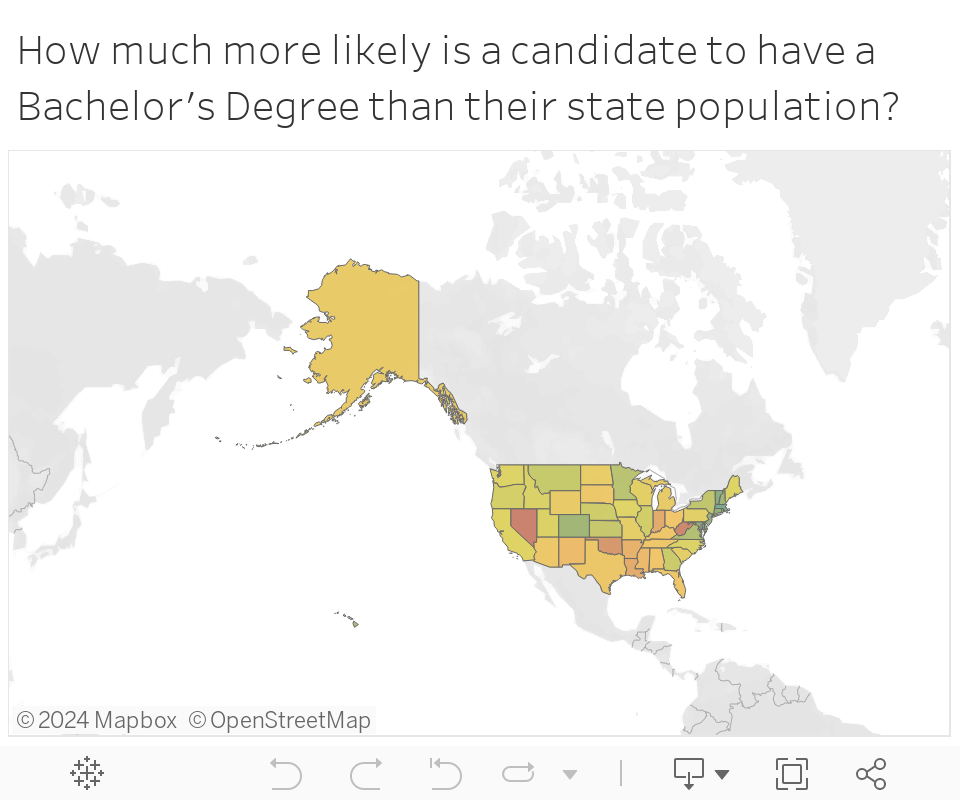
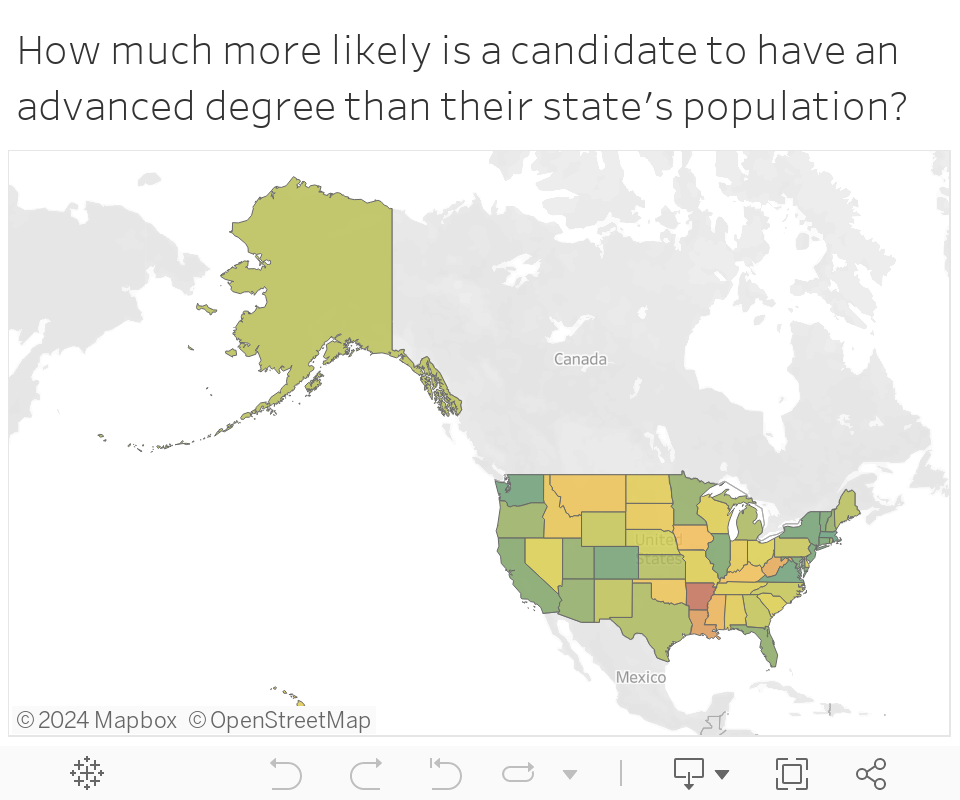
Candidate higher education levels
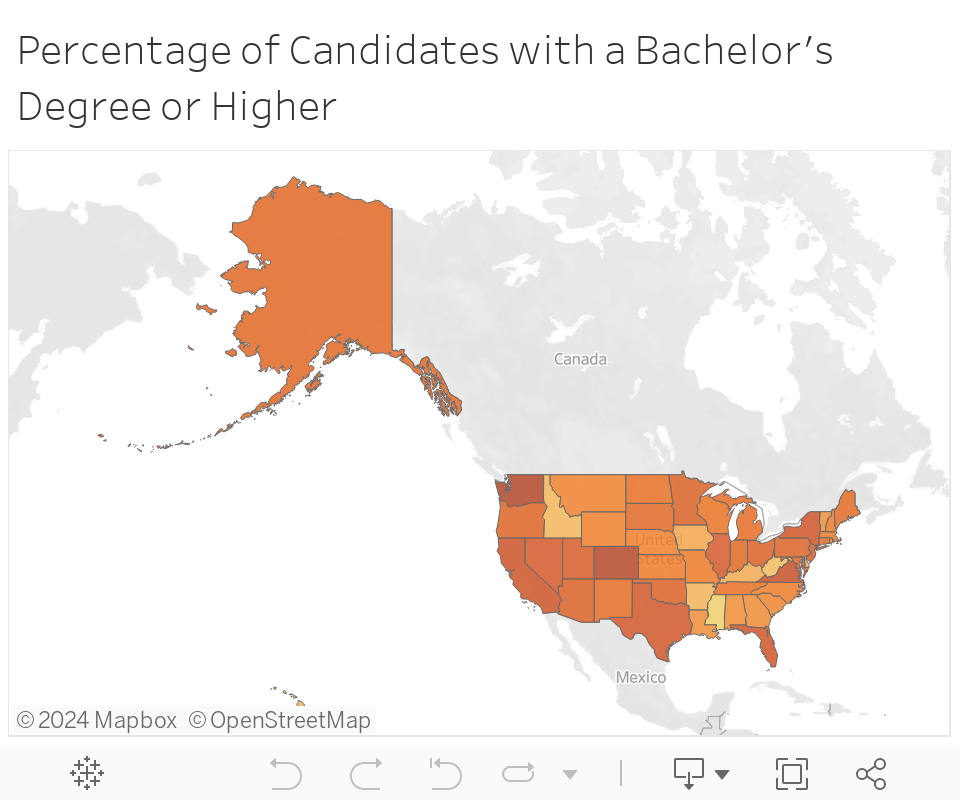
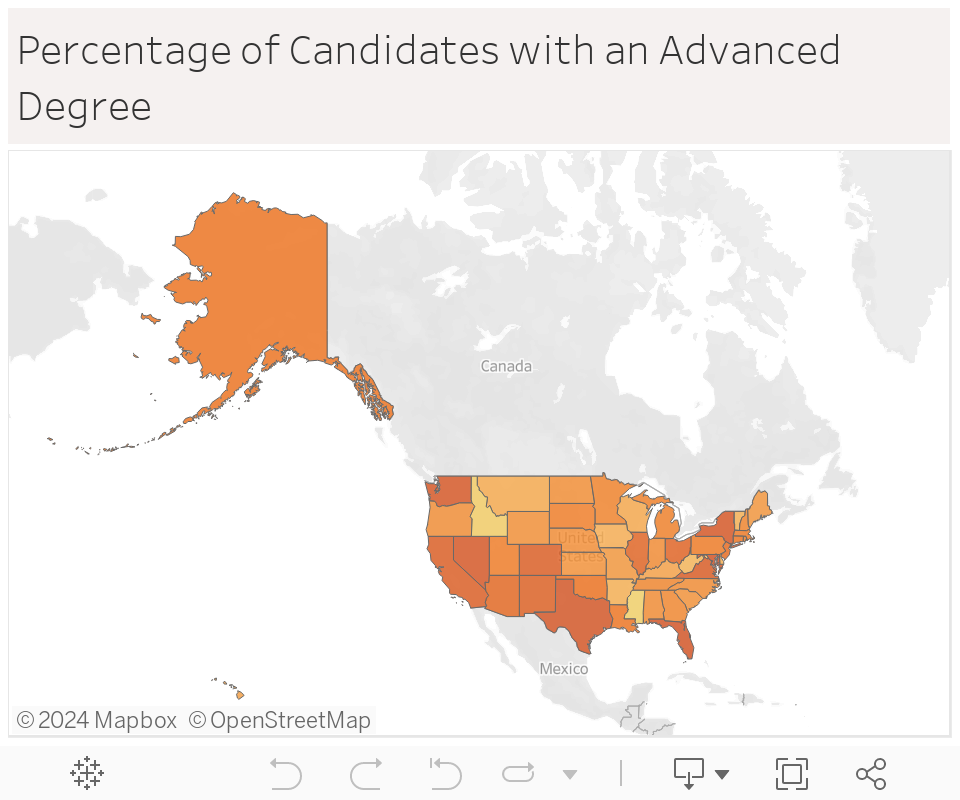
Above are graphs which show the percentage of candidates in each state that hold bachelor’s degrees, and advanced degrees. This ranges from 57% (Mississippi) to 79% (Washington and Virginia) for a bachelor’s degree, and 22% (Mississippi) to 35% (Maryland) for advanced degrees.
Very generally, states with higher levels of education among the general population have electoral options with more post-secondary education. Across the board, candidates are more likely to have some post-secondary education than the general public. However, the disparity is not the same across states.
Where a candidate in Massachusetts is only 1.54 times as likely to hold a bachelor’s degree as their constituents, that number goes up to 2.89 times as likely in Nevada. The disproportion grows when considering advanced degrees (which includes degrees like master’s, PhDs , and JDs). Massachusetts is again the most representative (candidates are 1.5 times as likely to have an advanced degree than their population). However, a candidate in Nevada is 3.82 times as likely to hold an advanced degree than their constituents.